

WATCHING Christian Petracca contemplate a handball to Jayden Hunt on Friday night – after marking 20m out from goal – was a vivid insight into the Demon's set-shot psyche.
Petracca's subsequent misfire to the left was a continuation of what's happening with him.
By night's end, the 23-year-old had six shots at goal from various situations for two goals, two behinds and two complete misses.
FANTASY FORM WATCH Big boys come out to play
Petracca is operating at an alarming 32.3 per cent accuracy from set shots since the start of last season – well below the League average of 51.1 per cent this year – after going at 68.4 per cent in 2017.
That dramatic change isn't necessarily uncommon, with players such as St Kilda's Tim Membrey, Eagle Jack Darling and Hawthorn's Jack Gunston also experiencing dramatic fluctuations.
Membrey is back to his deadeye-dick ways and stood out like a beacon on Saturday as the Saints' waywardness cost them ramming home a second-term advantage over Collingwood.
However, even he lost his radar last season, dipping to 44.8 per cent on set shots, compared to 75 per cent this year, 68.2 per cent in 2017 and 66.7 per cent in 2016.
Hawk sharpshooter Jack Gunston has been unusually inaccurate over recent seasons. Picture: AFL Photos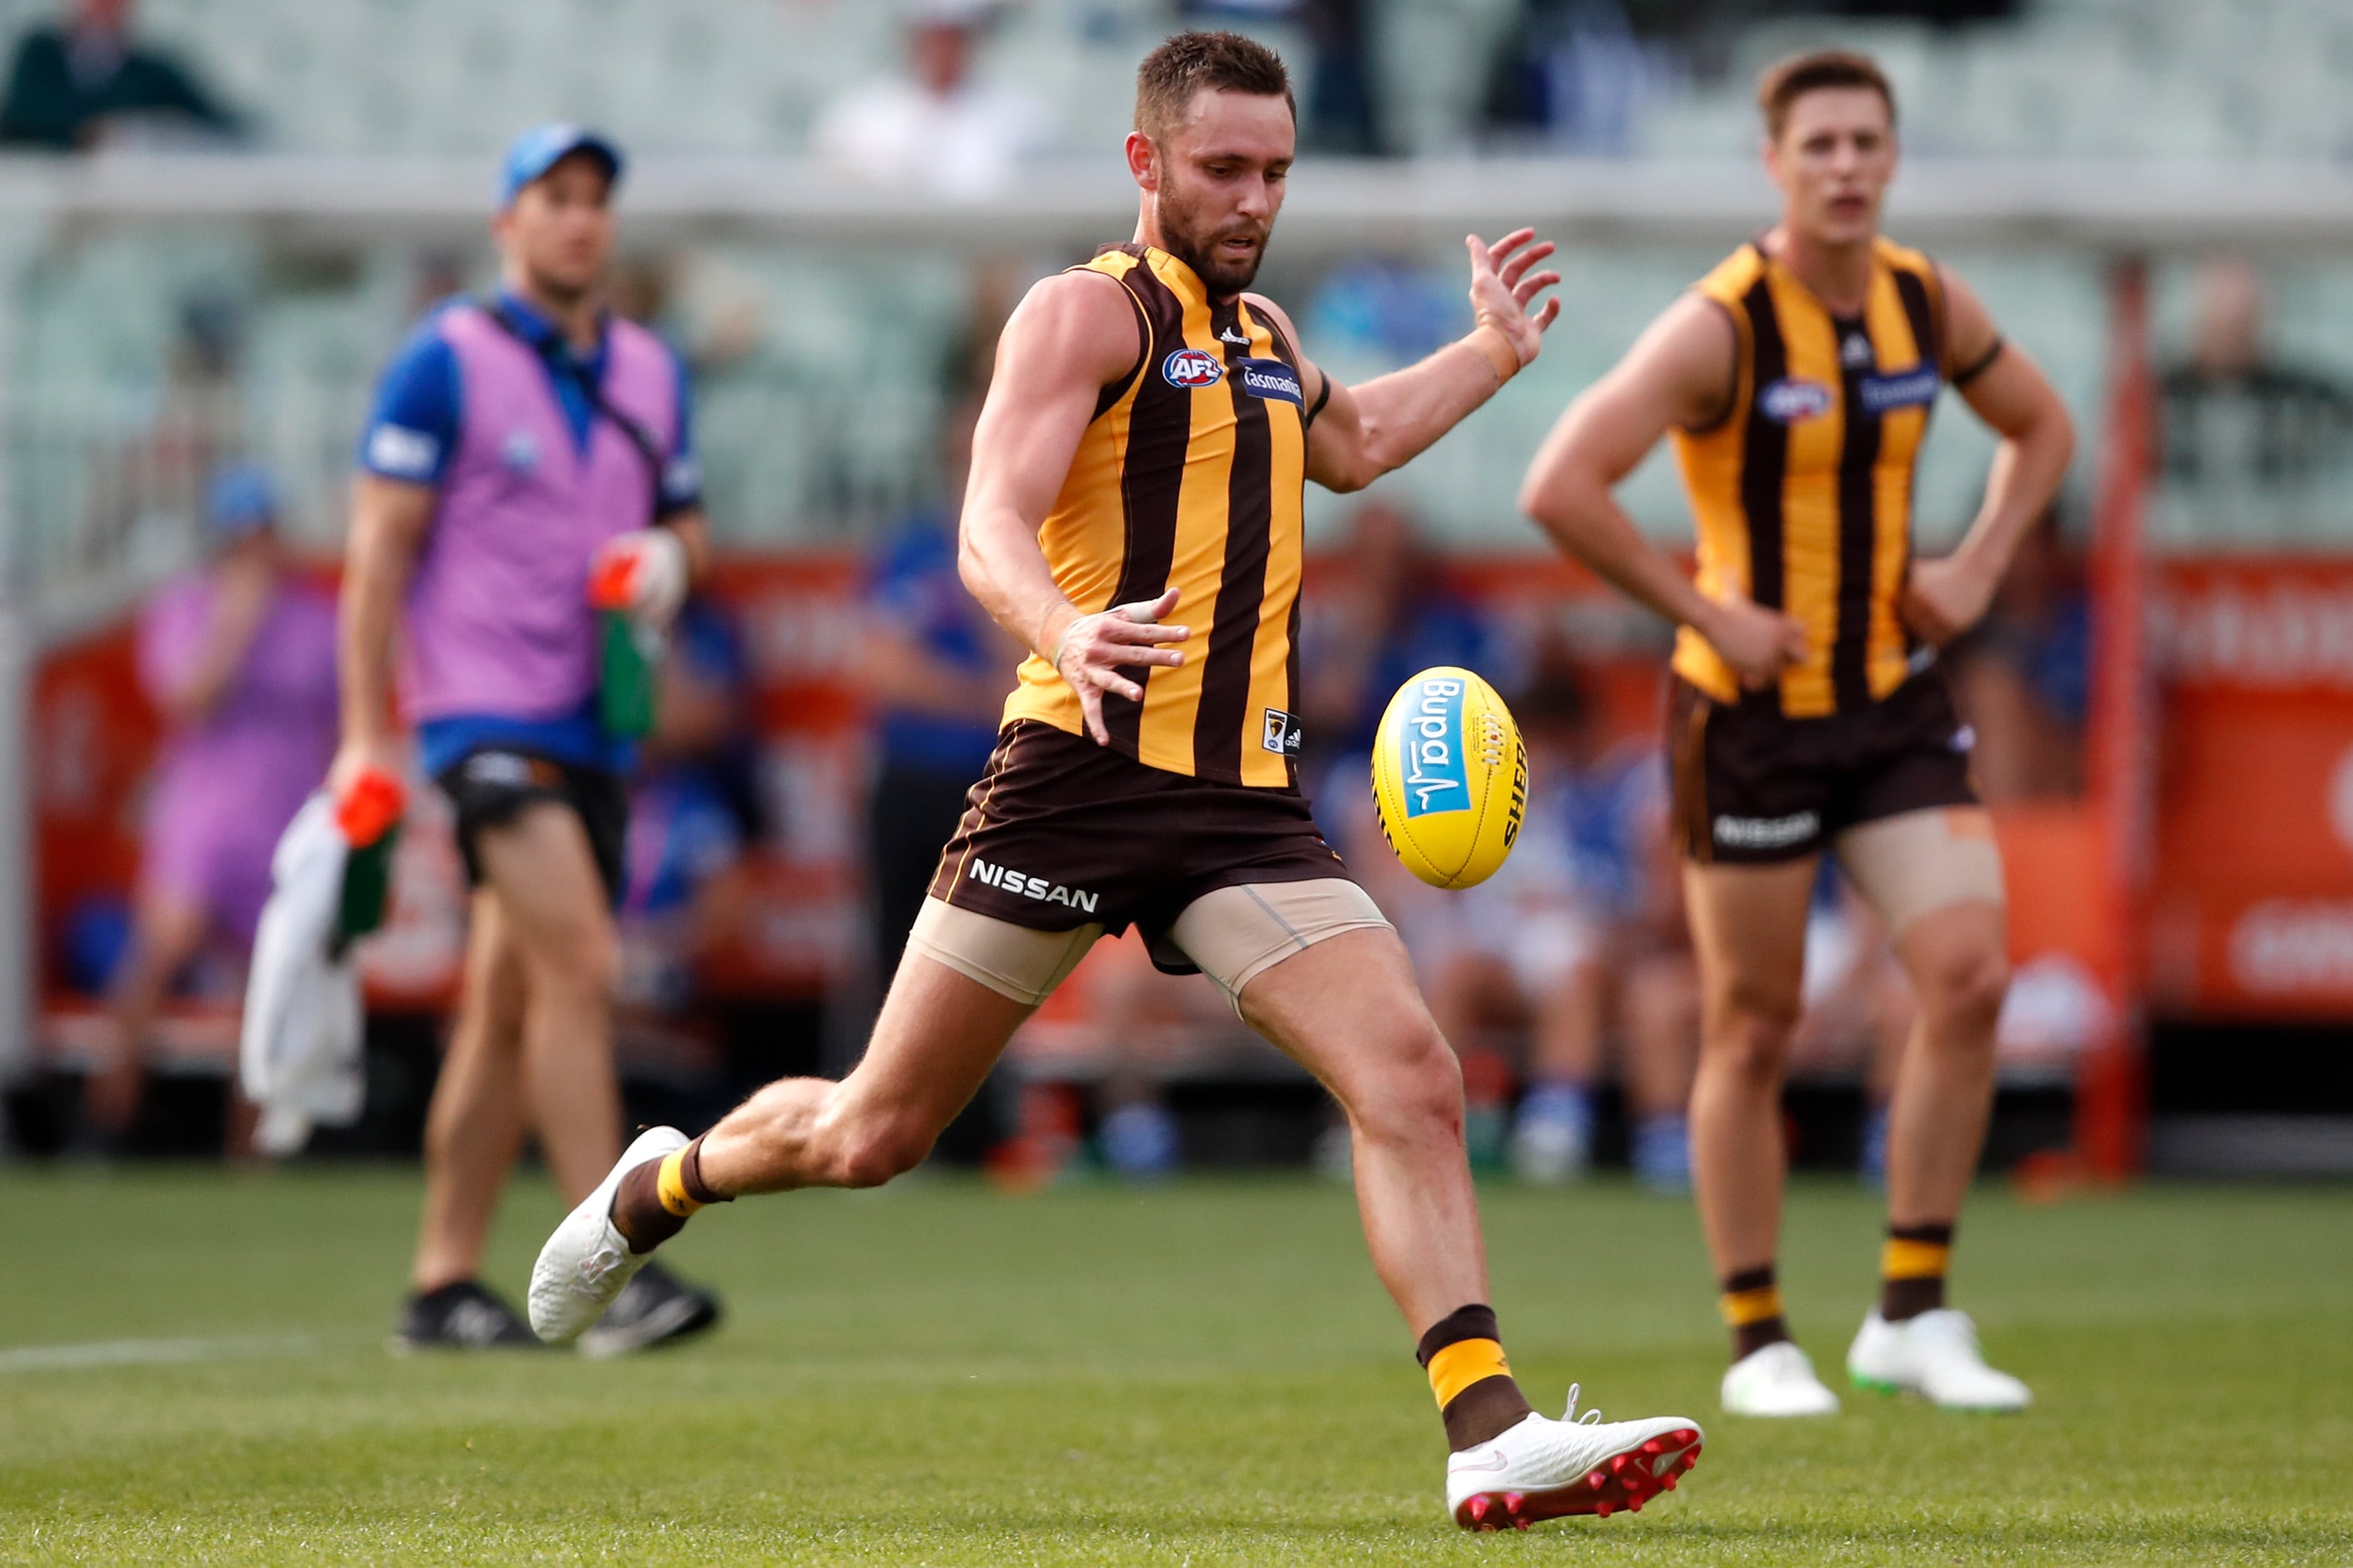
Gunston's reputation as a sharpshooter, established on an incredible 78.9 per cent set-shot success rate in 2013, could be under threat, given his fading record in front of the big sticks.
The Hawk goes against the grain, in that he is typically more efficient in general play than on set shots, whereas those attempts result in about 10 per cent less accuracy on average.
YEAR | SET SHOTS | IN PLAY | TOTAL |
2013 | 78.9% (38 shots) | 61.5% (26 shots) | 71.9% (64) |
2014 | 69% (58) | 54.5% (33) | 63.7% (91) |
2015 | 49.3% (67) | 63.2% (38) | 54.3% (105) |
2016 | 50.7% (67) | 58.6% (29) | 53.1% (96) |
2017 | 62.5% (16) | 56.2% (16) | 59.4% (32) |
2018 | 53.1% (49) | 56.8% (44) | 54.8% (93) |
2019 | 40% (20) | 33.3% (6) | 38.5% (26) |
TOTAL | 57.5% (315) | 57.8% (192) | 57.6% (507) |
Darling, on the other hand, has swung wildly in the past four years, from 61.8 per cent in 2016, down to 51.9 and 52.5 the following two seasons, then up to 61.1 per cent in 2019.
The set-shot art remains a mystery to some, but goalkicking guru David Wheadon told AFL.com.au the "fear of failure" was one of the main causes.
"I've coached really talented players who didn't like goalkicking. They didn't like set shots," Wheadon said.
BARRETT Big guns make flag chase a race in five
"(It's the) fear of failure and the embarrassment.
"That shot from 20m out on a bit of an angle is terrifying to some people, because the same shot 40m or 50m out, there's a forgiveness factor in it.
"It's no different than standing over a putt that maybe is half a metre – everybody will hang it on you if you miss it, but if you're 5m out, they'll accept it."
Competition averages on both set shots and shots on the run are also on a steady decline, with Wheadon contending the extra defensive focus was to blame for the latter.
SHOT TYPE | 2019 | 2018 | 2017 | 2016 | 2015 |
Set | 51.1% | 52.0% | 52.9% | 53.8% | 53.5% |
On Run | 41.0% | 42.7% | 45.4% | 46.8% | 47.0% |
There is a good sample size available through nine rounds this year to sort out the best and the worst clubs in front of goal.
The numbers paint Geelong as the AFL's most efficient side, with West Coast the only other team that kicks a goal from more than half of its shots at goal, including misses.
There are some quirks on the wider analysis, such as Sydney being the third-best club for set shots but comfortably the worst on the run.
CLUB | SET | ON THE RUN | SNAP | MARK, PLAY ON | OFF THE GROUND | OVERALL |
Geelong | 58.9% | 50.0% | 43.5% | 60.0% | 100.0% | 53.9% |
West Coast | 58.8% | 51.5% | 37.7% | 66.7% | 20.0% | 51.0% |
GWS Giants | 51.9% | 41.5% | 44.0% | 66.7% | 80.0% | 48.6% |
Richmond | 51.3% | 45.7% | 43.1% | 66.7% | 60.0% | 48.3% |
Carlton | 51.2% | 38.1% | 48.4% | 80.0% | 33.3% | 47.5% |
Brisbane | 51.3% | 46.3% | 38.0% | 71.4% | 50.0% | 47.0% |
Hawthorn | 48.5% | 41.3% | 42.9% | 71.4% | 62.5% | 46.8% |
Fremantle | 54.5% | 57.9% | 24.1% | 25.0% | 25.0% | 45.5% |
Collingwood | 44.2% | 54.9% | 40.5% | 57.1% | 20.0% | 45.4% |
Sydney | 57.1% | 30.0% | 27.3% | 40.0% | 83.3% | 45.0% |
Adelaide | 48.7% | 41.3% | 41.7% | 33.3% | 28.6% | 44.6% |
Essendon | 46.8% | 37.5% | 43.8% | 62.5% | 0.0% | 44.4% |
North Melbourne | 51.8% | 31.3% | 38.0% | 85.7% | 0.0% | 44.3% |
Melbourne | 46.7% | 42.6% | 36.7% | 63.6% | 50.0% | 44.3% |
St Kilda | 51.9% | 40.4% | 29.3% | 60.0% | 33.3% | 43.7% |
Port Adelaide | 52.8% | 35.9% | 32.5% | 33.3% | 25.0% | 42.9% |
Gold Coast | 47.1% | 34.4% | 37.9% | 100.0% | 50.0% | 42.5% |
Western Bulldogs | 46.2% | 35.0% | 35.0% | 33.3% | 0.0% | 41.0% |
FULL FIXTURE Every round, every game
Winning the territory battle
St Kilda's second-quarter domination of Collingwood – in basically every way but the scoreboard – is laid bare in one number.
The ball was in the Saints' forward half for 74.6 per cent of the term, the third-highest percentage of any team in a quarter this season.
Only Port Adelaide in the third term on Sunday at Gold Coast's expense (80 per cent) and the final quarter in round five against West Coast (75.2 per cent) beat St Kilda's effort.
The Saints had it all over the Pies in the second term but couldn't convert their chances. Picture: AFL Photos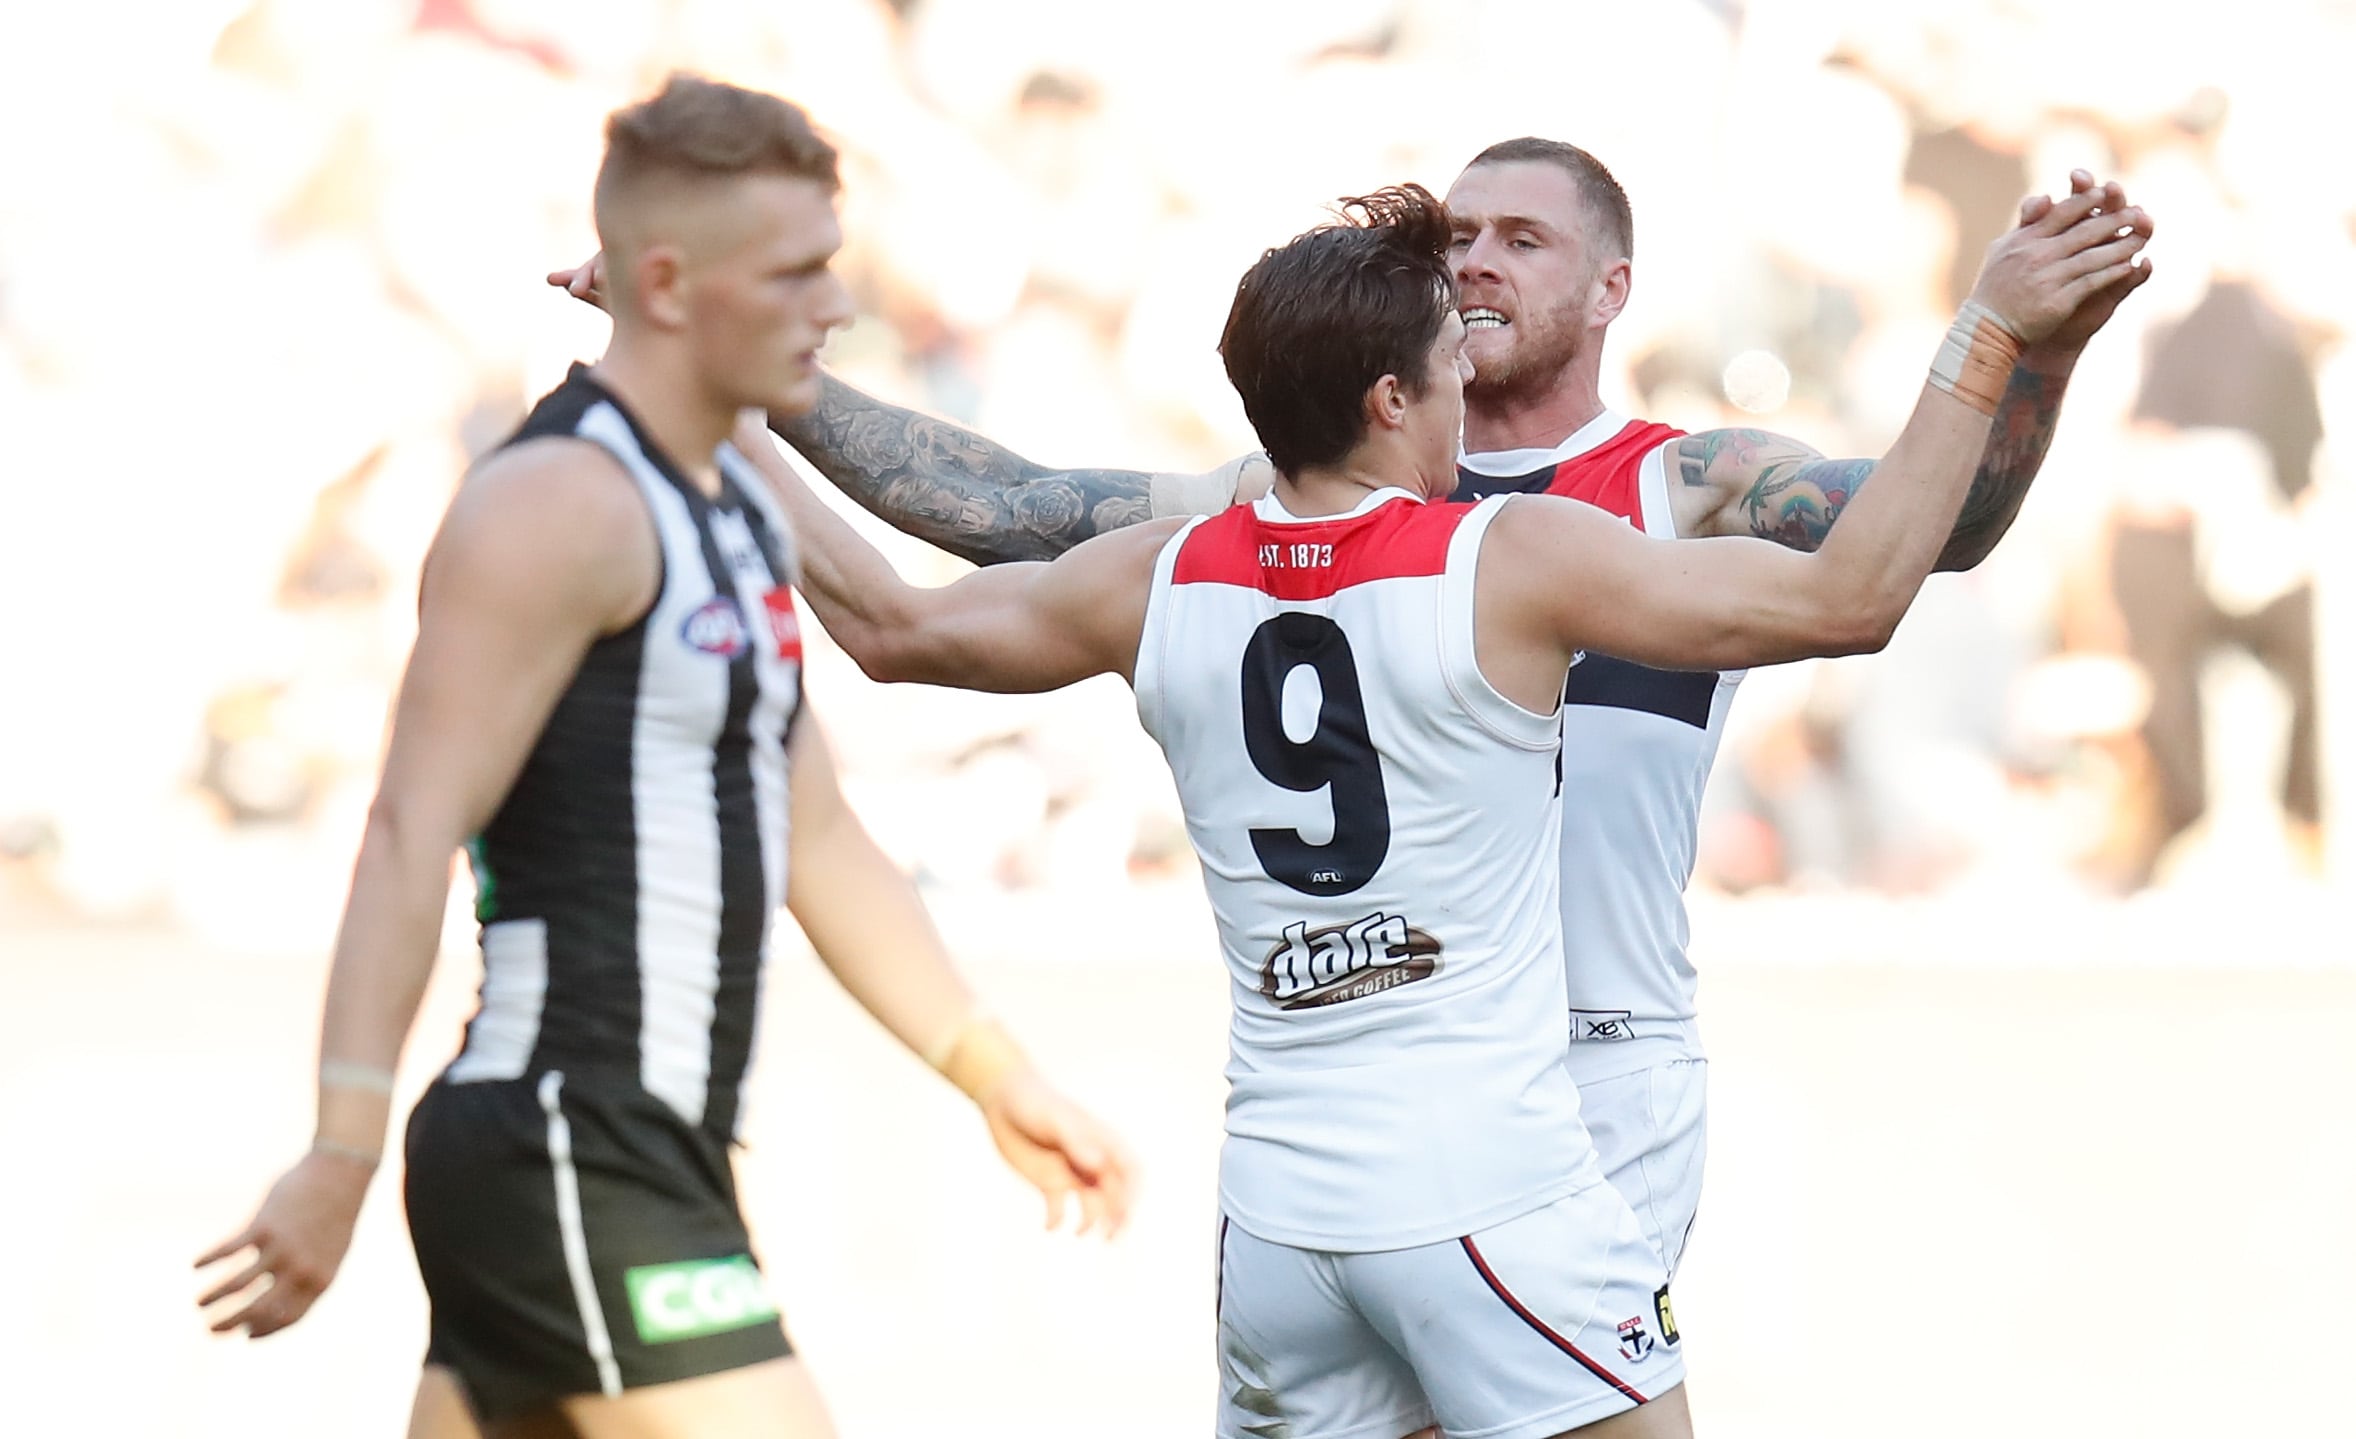
Beastly Lion achieves rare feat
Brisbane recruit Lachie Neale continues to pile up extraordinary numbers in his first season in Queensland.
Neale's weekend line against Adelaide was just the latest: 39 disposals, 22 contested possessions, 12 clearances and six tackles.
You're right if you thought they weren't run-of-the-mill statistics, because only one other player this year has managed them in combination.
That footballer is Melbourne's Clayton Oliver, who recorded 44 disposals, 25 contested possessions, 13 clearances and six tackles against Geelong in round two.
It also happened just five times across the past four seasons.
WHO MAKES FINALS? Do the 2019 Ladder Predictor
Giants rack them up
Nic Newman was the sole Blue to amass more than 18 disposals in Sunday's 93-point hammering from Greater Western Sydney.
The ex-Swan's 29 touches made him a standout for mostly the wrong reasons.
Thirteen of the game's other top 14 ball-winners were all Giants, marking just the seventh time on record this has happened.
SEASON | ROUND | TEAM | OPPOSITION |
2019 | 9 | GWS Giants | Carlton |
2012 | 7 | Hawthorn | Melbourne |
2012 | 3 | Richmond | Melbourne |
2009 | 5 | Geelong | Brisbane |
2008 | 4 | Richmond | Fremantle |
2007 | QF | Geelong | North Melbourne |
2000 | 6 | Carlton | Port Adelaide |
