

NO AFL footballer has conceded more points from turnovers this year than Essendon's big-name midfield recruit Dylan Shiel.
Let's get that out of the way nice and early.
Shiel's polarising 34-disposal Anzac Day performance at a packed MCG was lauded in some quarters, whereas others were keener to highlight his 10 turnovers. Note, he made AFL.com.au's Team of the Week.
Collingwood kicked two goals off those giveaways – crucial in a four-point game – taking the ex-Giant's season tally in that department to a League-leading 50 points from 10 scoring shots.
WHO MAKES FINALS? Do the 2019 Ladder Predictor
However, closer scrutiny of Shiel's disposals, perhaps, illustrates he might be too harshly painted as a turnover merchant, particularly given the weight of possession he is gathering.
AFL.com.au has focused on three stars of the game – Shiel, West Coast's Andrew Gaff and Hawk Jaeger O'Meara – whose ball-winning feats this year have coincided with high turnovers.
Gaff's 11 turnovers in round six were more than anyone else, and he is averaging a competition-high 8.5 across his four matches since returning from suspension.
Gaff's gaffes: Eagle is averaging the most turnovers in the AFL since his return. Picture: AFL Photos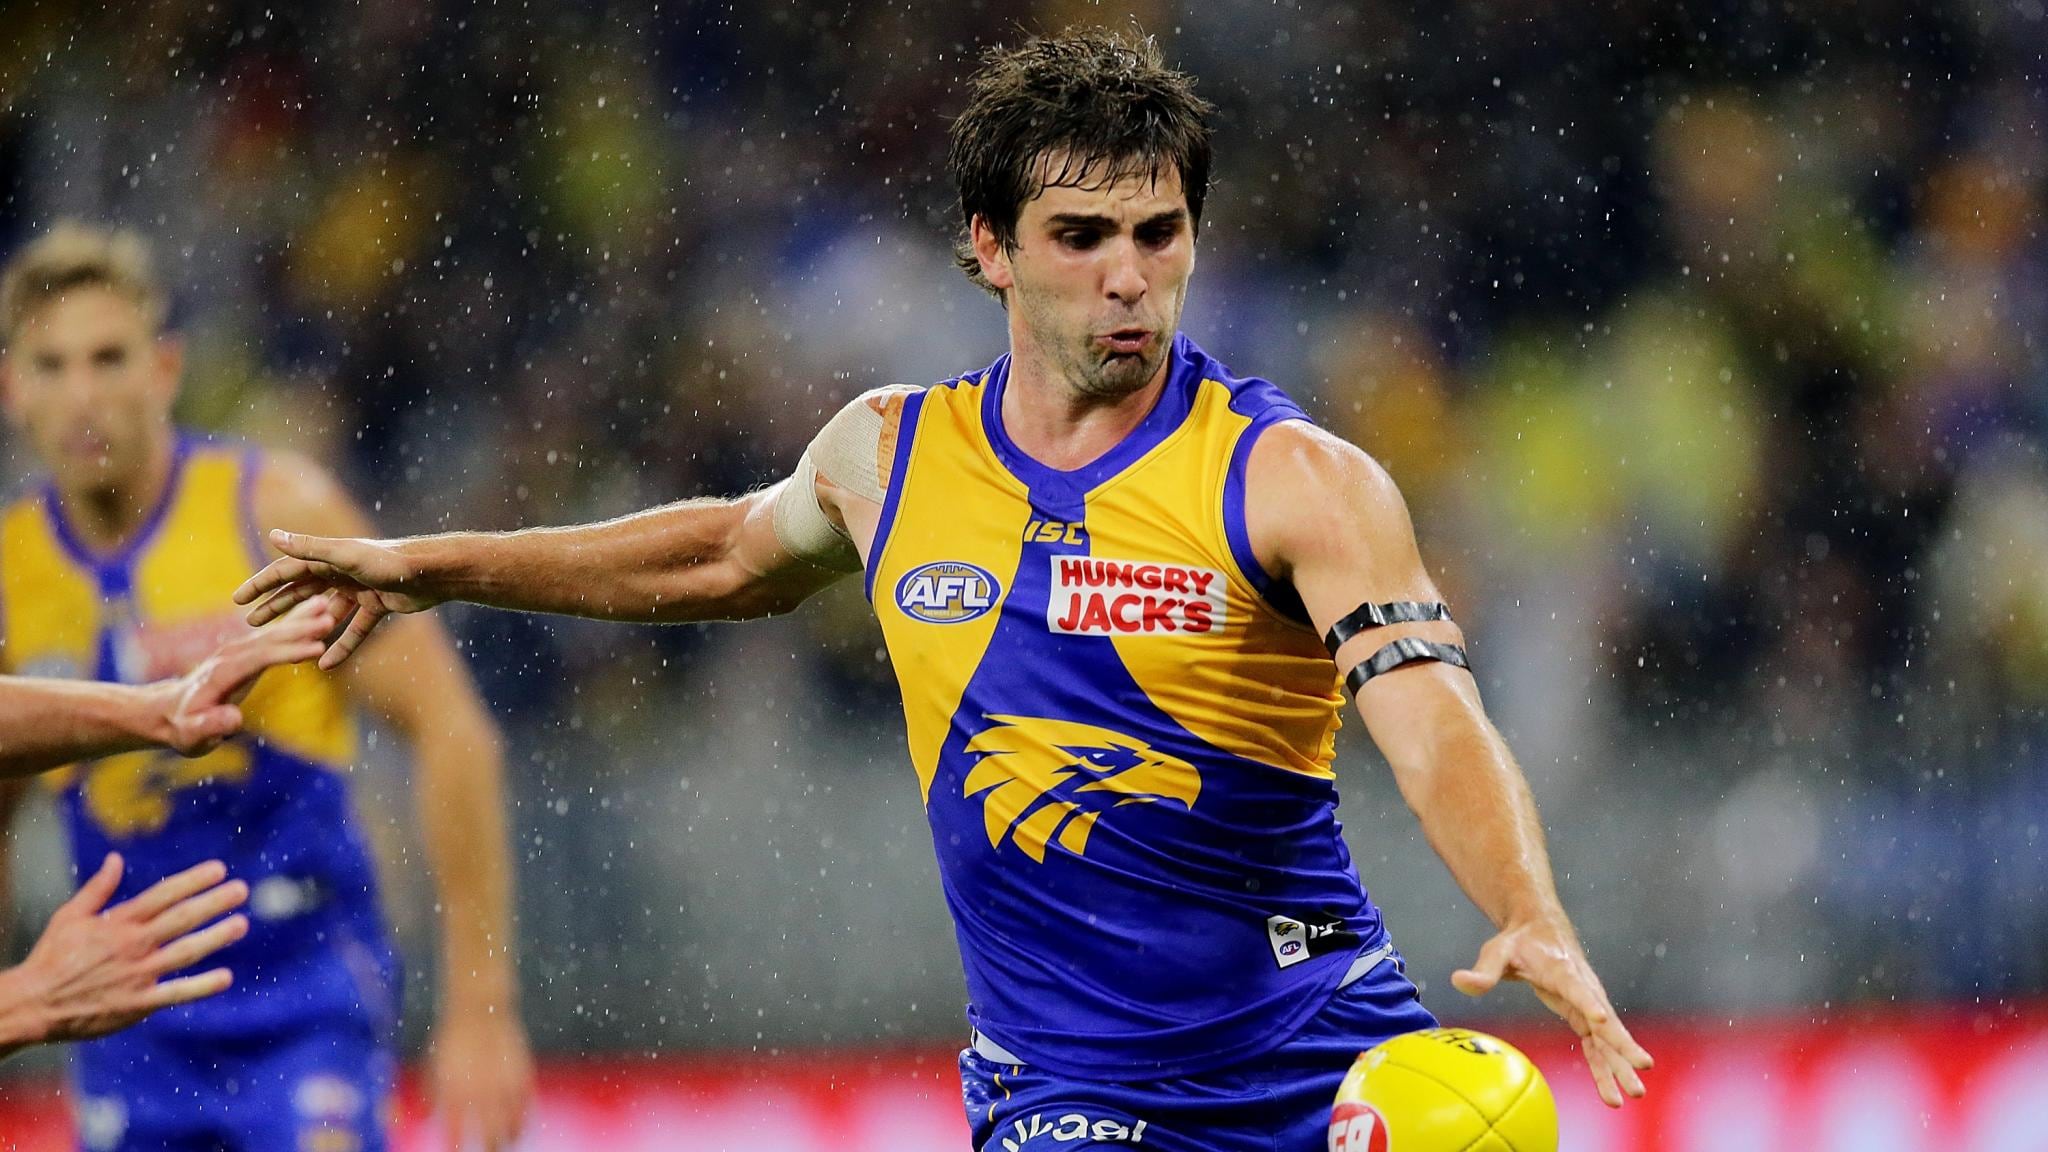
O'Meara, his club's No.1 midfielder in Brownlow medallist Tom Mitchell's absence, had eight of his own among a personal-best 43 possessions in Hawthorn's come-from-behind victory over Carlton on Sunday.
That gave him a whopping 35 in his five matches this year, at an average only Gaff surpasses.
This is the basic data, but Champion Data offers increasingly greater depth in how to interpret all this.
FULL INJURY LIST Who's ruled out and who's a test?
The AFL's official number-cruncher tracks how many scores are generated off turnovers, disposals by turnover and whether they were in general play or clearing from a stoppage.
The analysis goes even deeper into takeaways (opposition wins the ball back from a contest or free kick), and unforced (corralling or no pressure) or forced giveaways (under physical or closing pressure).
With all that in mind, how do Shiel, Gaff and O'Meara compare in season 2019, and how harshly should we judge their individual turnovers?
PLAYER | TURNOVERS PER GAME | DISPOSALS BY TURNOVER | POINTS CONCEDED | TAKEAWAYS | UNFORCED GIVEAWAYS |
Andrew Gaff | 8.5 | 3.9 | 10.3 | 5.5 | 1.0 |
Jaeger O'Meara | 7 | 4.4 | 5.6 | 3.6 | 1.8 |
Dylan Shiel | 6 | 5 | 8.3 | 2.8 | 0.7 |
Jaeger O'Meara commits the most unforced giveaways of the star trio. Picture: AFL Photos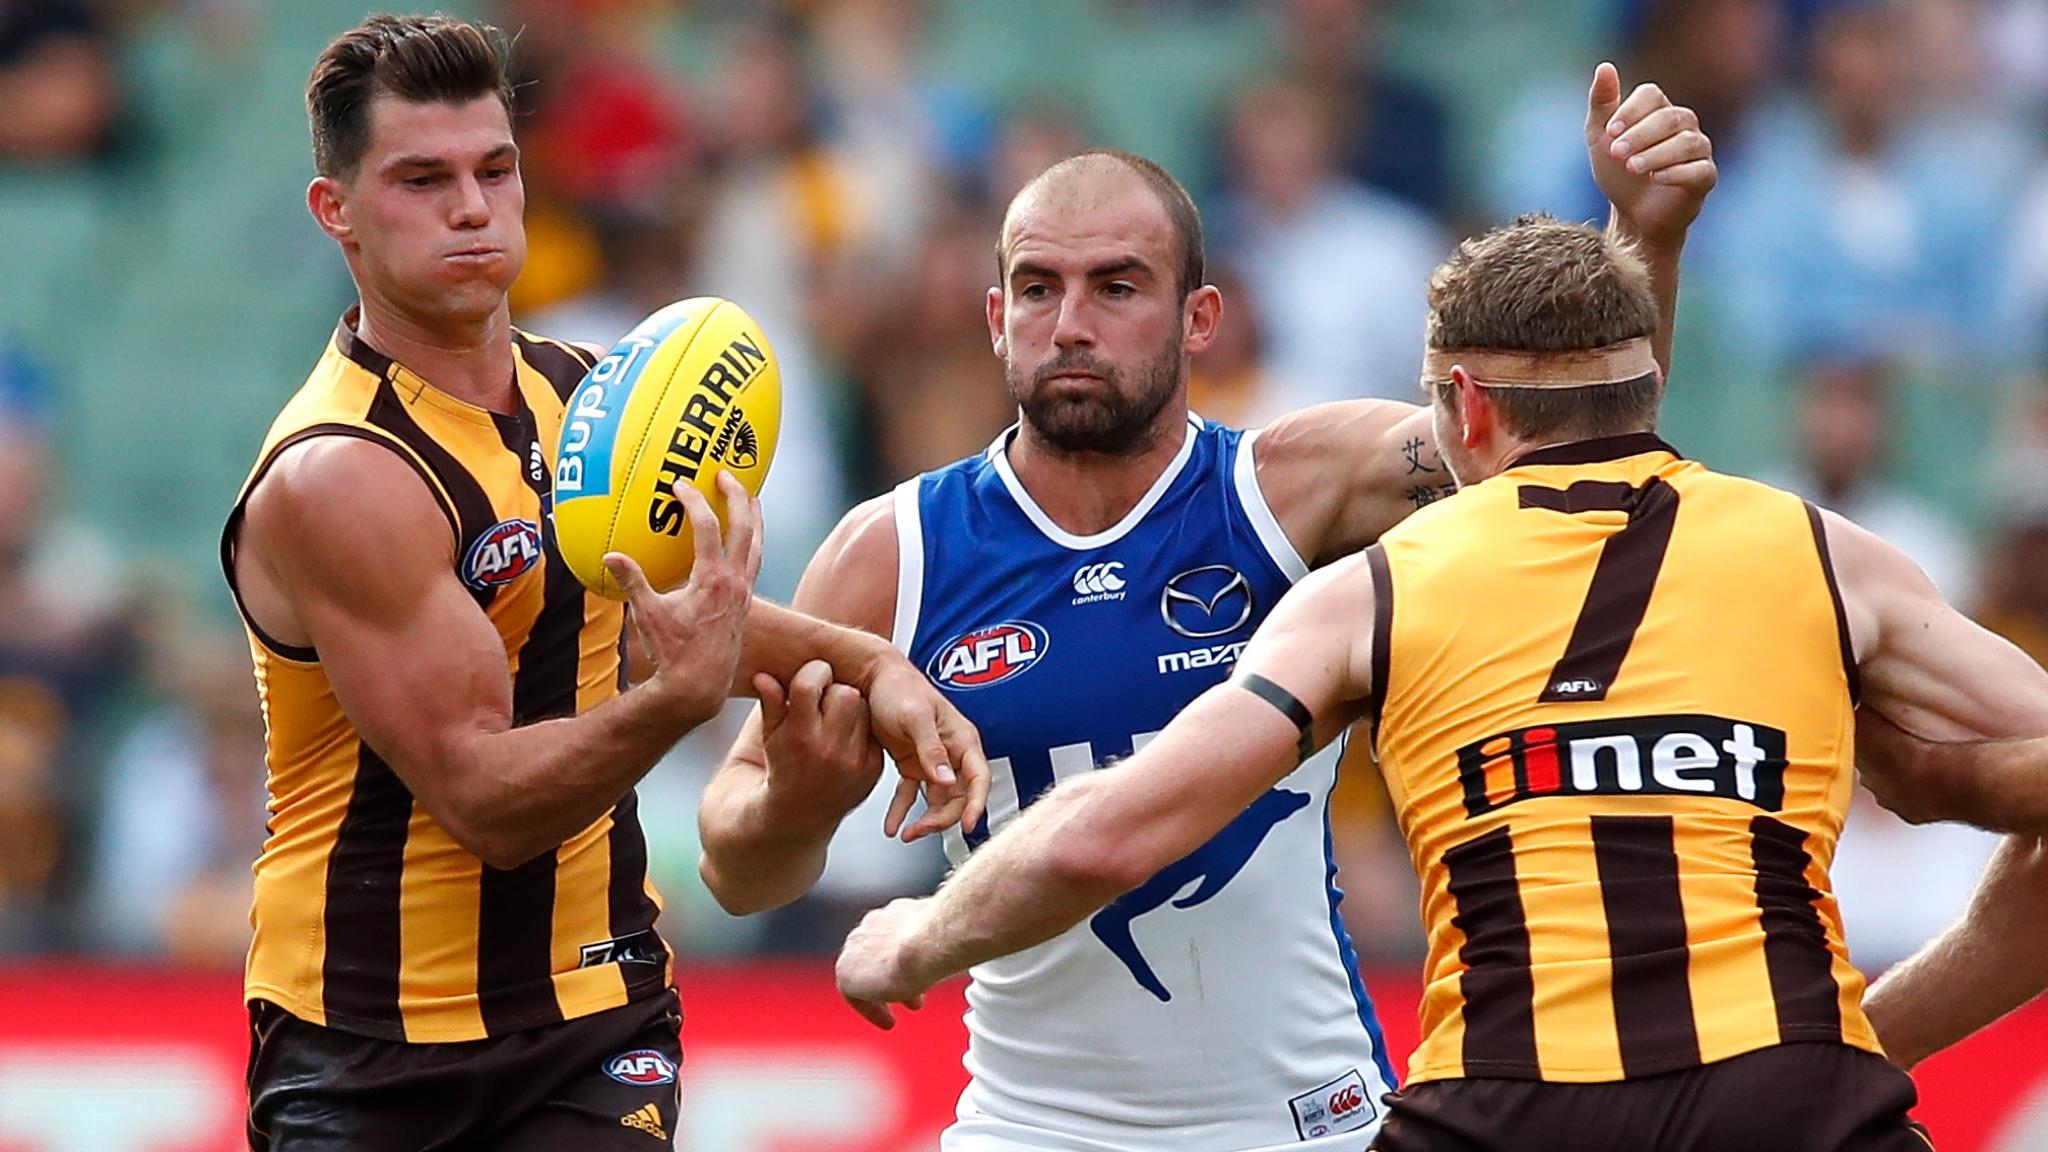
O'Meara concedes easily the fewest points of the trio from his turnovers, yet commits the most unforced giveaways, so his is an interesting set of numbers to digest.
Gaff, who has played one fewer game than O'Meara and two fewer than Shiel, is on track at this stage to overtake Shiel in the unwanted category of points conceded from turnovers.
The statistics aren't kinder for the Eagle, at least for this year, once the sophisticated kick rating model is factored in.
Kick rating takes into account the difficulty of the attempt, with an 'expected' percentage given to each kick's chance of being accurate.
For example, if a player successfully completes a kick and it was rated just a 38 per cent chance of that result, that player gains plus-62 per cent for that kick.
Find Trends on Apple Podcasts, Google Podcasts and Spotify
The player would be minus-38 per cent if the kick is unsuccessful in that scenario.
Gaff is +1.3 per cent since 2011, which places him 155th out of the 478 players with at least 500 kicks in that period.
Shiel and O'Meara are -2.2 per cent (397th) and -2.3 per cent (402nd), respectively.
Both Gaff (-11.9 per cent) and O'Meara (-8.1 per cent) are far worse this season than their career kick rating, whereas Shiel (-3.9 per cent) is historically similar.
The Bomber comes in at No.81 in kick rating out of the players in the top 100 for total kicks, while the other two rank even lower, as the below tables illustrate.
BEST KICK RATING (OF TOP 100 TOTAL KICKS)
PLAYERS | CLUB | KICKS | EXPECTED | HIT RATE | RATING |
Shannon Hurn | West Coast | 132 | 67.4% | 78.0% | +10.6% |
Daniel Rich | Brisbane | 129 | 63.2% | 72.1% | +8.9% |
Caleb Daniel | Western Bulldogs | 108 | 54.1% | 63.0% | +8.9% |
Brayden Maynard | Collingwood | 75 | 58.9% | 66.7% | +7.8% |
Jake Lloyd | Sydney | 135 | 57.5% | 65.2% | +7.7% |
Conor McKenna | Essendon | 87 | 60.3% | 67.8% | +7.5% |
James Sicily | Hawthorn | 116 | 58.9% | 66.4% | +7.4% |
Matthew Suckling | Western Bulldogs | 75 | 63.7% | 70.7% | +6.9% |
Lewis Jetta | West Coast | 78 | 64.9% | 71.8% | +6.9% |
Alex Witherden | Brisbane | 106 | 61.0% | 67.9% | +6.9% |
WORST KICK RATING (OF TOP 100 TOTAL KICKS)
PLAYERS | CLUB | KICKS | EXPECTED | HIT RATE | RATING |
Andrew Gaff | West Coast | 74 | 48.4% | 36.5% | -11.9% |
Jack Martin | Gold Coast | 70 | 58.3% | 48.6% | -9.7% |
Marc Murphy | Carlton | 91 | 49.9% | 40.7% | -9.3% |
Tim Kelly | Geelong | 83 | 47.4% | 38.6% | -8.9% |
Alex Keath | Adelaide | 80 | 67.0% | 58.8% | -8.2% |
Elliot Yeo | West Coast | 70 | 46.8% | 38.6% | -8.2% |
Jaeger O'Meara | Hawthorn | 80 | 46.8% | 38.8% | -8.1% |
David Mundy | Fremantle | 79 | 43.3% | 35.4% | -7.9% |
Matt Taberner | Fremantle | 76 | 51.6% | 44.7% | -6.9% |
Adam Tomlinson | GWS | 72 | 55.3% | 48.6% | -6.6% |
Which teams thrive in the turnover game?
So much is made of Geelong's renewed forward-half pressure this year, but more attention should be devoted to its ability to avoid turning over the ball.
The Cats are conceding just 30.2 points per game off turnovers, with the next-stingiest side, Fremantle (41.7), coughing up more than 10 extra points.
The competition average is 48.8 points against on turnover, as a further indication of how impressive their efforts so far are.
On the opposite end of the scale, struggling Melbourne and the Western Bulldogs are gifting their opposition 58.7 and 58.3 points respectively.
Remaining clubs: Hawthorn (43.3), Carlton (44.2), GWS (45.7), Port Adelaide, Gold Coast and Collingwood (all 46), St Kilda (46.2), Adelaide (47.7), West Coast (51.8), Sydney (52.5), Richmond (52.7), Essendon (54.7), Brisbane (55.2) and North Melbourne (57.7).
Single game and season records
Docker Harley Bennell holds the undesirable record of committing the most turnovers in one match at 15, against Adelaide in round 17, 2015 while he was still playing for Gold Coast.
Bennell won 39 possessions (16 contested) that day in a 45-point defeat, with just one of them an unforced giveaway and 12 of them in general play.
This statistic is available since only 2010, so someone not on record may have surpassed Bennell's game.
Meanwhile, the Cairns quagmire North Melbourne and Gold Coast played in to kick off their 2018 campaigns produced the most combined turnovers in one game.
They racked up 221 between them, with the Roos' 114 the most on record and the Suns the second-most at 107.
The biggest turnover differential came in round 21, 2011, when Port Adelaide committed 27 more than Hawthorn.
As for the season highs, Gary Ablett leads the individual category at 148, while Gold Coast's 1708 last year is the most as a team.
