

HIS SCALPS this year are a who's who of the AFL.
Dustin Martin. Tim Kelly. Jaeger O'Meara. Patrick Cripps. Clayton Oliver. David Swallow. Ben Cunnington.
Greater Western Sydney's Matt de Boer has continued to reinvent himself to remain a regular cog in the Giants' machine in his three seasons at the club since Fremantle cut him loose.
His latest reincarnation as a run-with midfielder – a role he previously fulfilled – is striking fear into the AFL's finest, with Saint Seb Ross the only opponent who exceeded expectations opposed to de Boer.
De Boer gets under the skin of Melbourne star Clayton Oliver. Picture: AFL Photos
Champion Data's 'tagger' rating suggests it's a two-horse race this season between de Boer and West Coast's Mark Hutchings as the game's best shutdown man.
The rating system measures how players perform from an AFL Ratings points perspective in a particular match-up, with only match-ups of at least 40 minutes counting as 'major'.
There are defensive and offensive ratings in this case, with the former predicated on how your opponent, in percentage terms per 100 minutes, fared according to their season average in AFL Player Ratings.
A positive defensive rating for de Boer, who kept All Australian bound Roo Cunnington to 16 disposals on Sunday – 13 below his previous season average – means he has won the match-up.
ROUND | OPPOSITION | OPPONENT | TIME (rounded to mins) | R100 | EXP | ADJ DIFF |
3 | Richmond | Dustin Martin | 54 | 1.2 | 16.3 | +85.7% |
4 | Geelong | Tim Kelly | 47 | 1.8 | 12.2 | +78% |
7 | St Kilda | Seb Ross | 76 | 15.9 | 11.6 | -44% |
8 | Hawthorn | Jaeger O'Meara | 49 | 6.5 | 11.4 | +35.5% |
9 | Carlton | Patrick Cripps | 74 | 4.8 | 14.7 | +60.4% |
10 | Melbourne | Clayton Oliver | 78 | 5.2 | 15.6 | +59.9% |
11 | Gold Coast | David Swallow | 47 | 8.4 | 11.3 | +18.5% |
13 | North Melbourne | Ben Cunnington | 58 | 8.6 | 16.3 | +40.2% |
De Boer's tagger rating of +43% among those with at least five match-ups is No.2 in the competition, behind only Hutchings' +48%.
Mark Hutchings does battle with GWS gun Stephen Coniglio. Picture: AFL Photos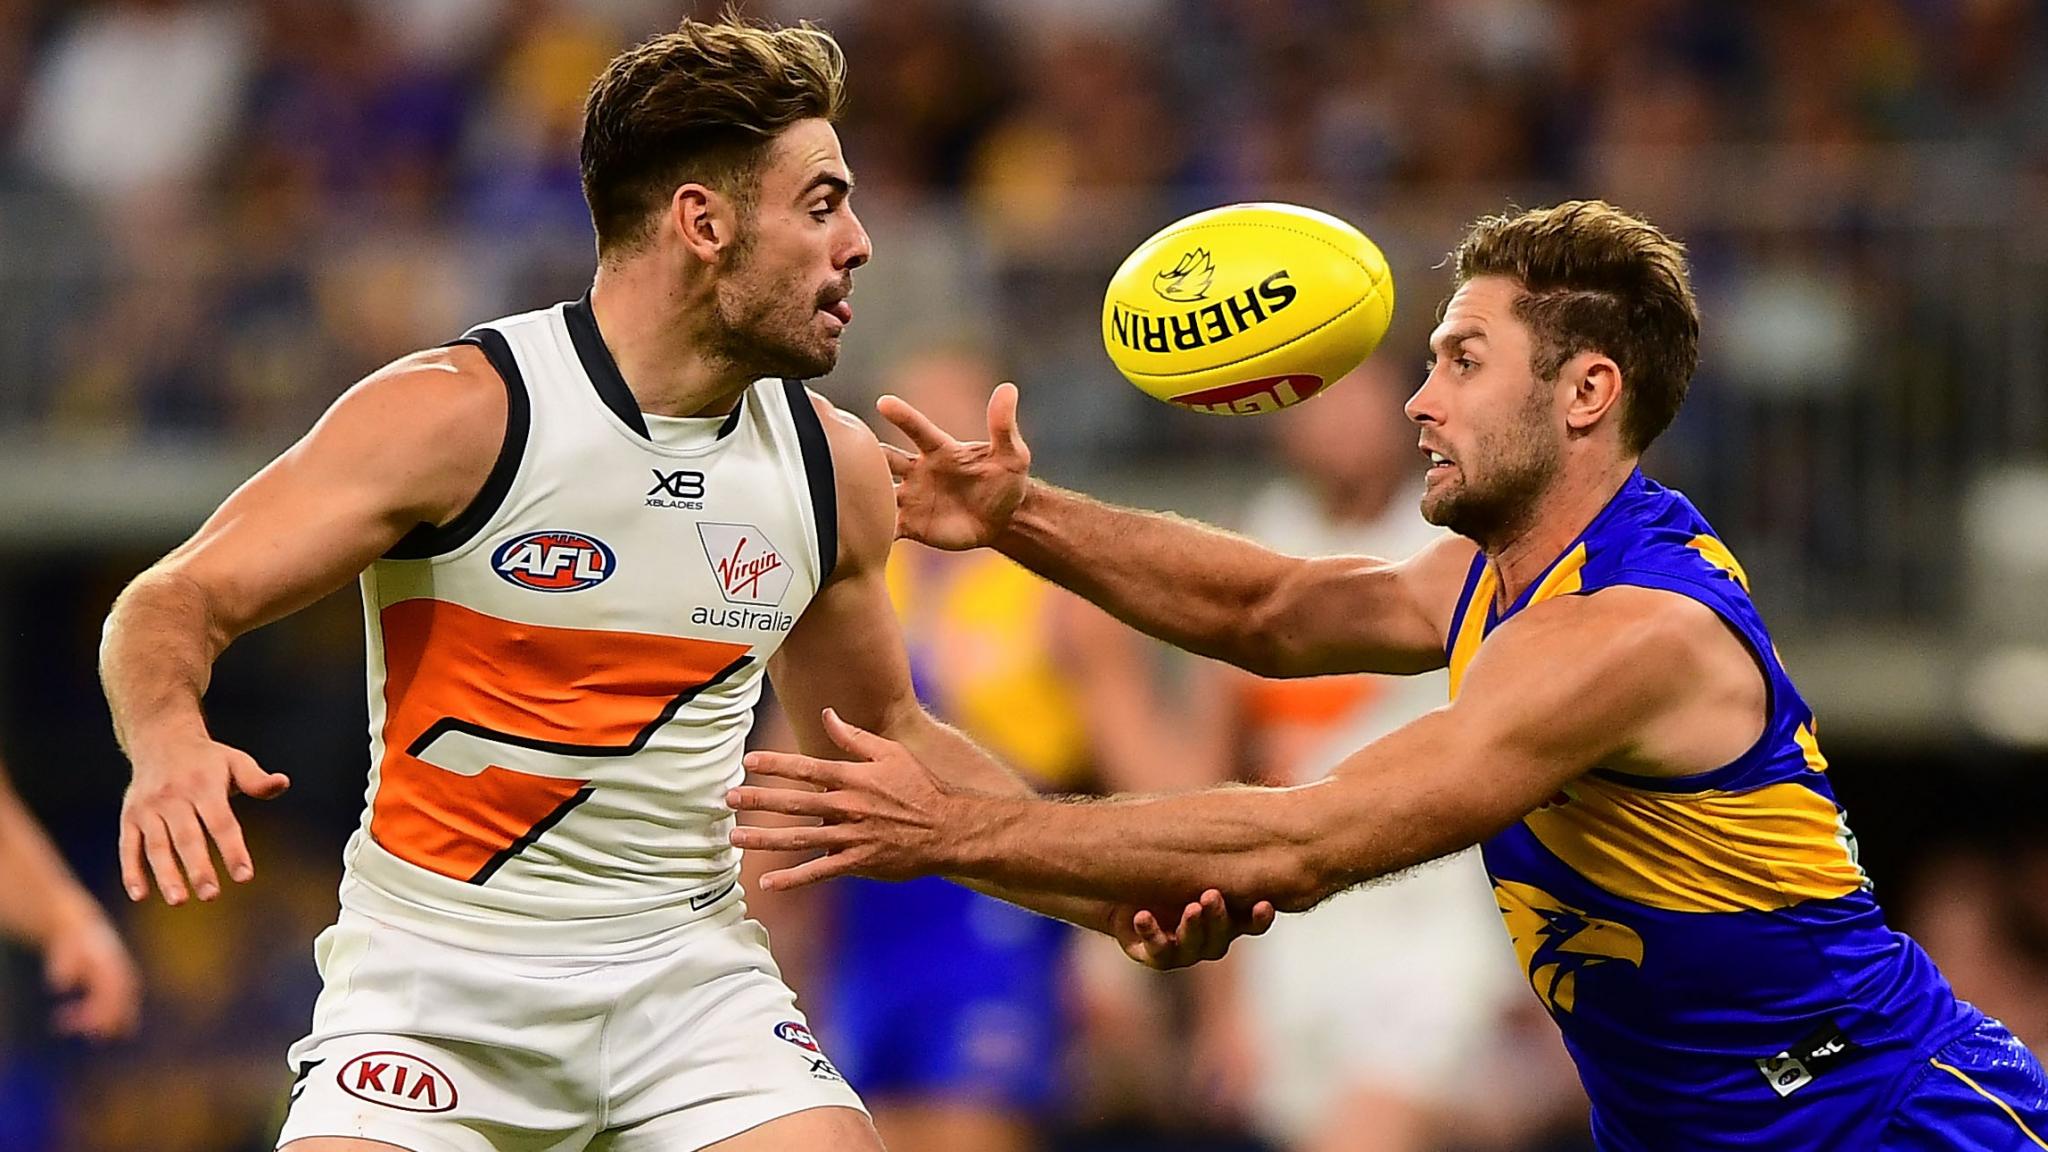
Making the debate more complex about which one of them is performing better is that de Boer's opponents have a higher expected AFL Player Rating output and he has more match-ups.
Both players are well ahead of their peers, as the table below illustrates, although Demon James Harmes' +44% in three 40-minute-plus match-ups would place him with them if he qualified.
PLAYER | CLUB | POSITION | 40+ MINUTE MATCH-UPS | OPP. AFL PLAYER RATING | EXPECTED | ADJ DIFF |
Mark Hutchings | West Coast | Wing | 5 | 5.8 | 11.7 | +48% |
Matt de Boer | GWS Giants | Midfield | 8 | 6.9 | 13.8 | +43% |
Ryan Clarke | Sydney | Wing | 6 | 11.1 | 12.1 | +5% |
Ed Curnow | Carlton | Mid-Fwd | 8 | 11.6 | 11.1 | -1% |
Jack Steele | St Kilda | Midfield | 8 | 15.3 | 14.3 | -4% |
George Hewett | Sydney | Midfield | 7 | 14.4 | 13.9 | -7% |
Defining who does and doesn't fit the 'tagger' category can be difficult, so all other players with a positive rating in this category appear in the following table.
This group is dominated by wingmen, who aren't necessarily glued to each other across the ground.
PLAYER | CLUB | POSITION | 40+ MIN. MATCH-UPS | AFL PLAYER RATING | EXPECTED | ADJ DIFF |
Rory Atkins | Adelaide | Wing | 8 | 5.5 | 9 | +41% |
Lachie Whitfield | GWS Giants | Mid-Fwd | 6 | 4.5 | 8.3 | +39% |
Patrick Cripps | Carlton | Midfield | 16 | 8.8 | 11.2 | +26% |
Ed Langdon | Fremantle | Wing | 7 | 6.4 | 8.3 | +24% |
Jack Billings | St Kilda | Wing | 5 | 7.7 | 9.7 | +24% |
Jordan Clark | Geelong | Wing | 5 | 5.9 | 8.3 | +21% |
Jared Polec | North Melbourne | Wing | 9 | 6.5 | 8.2 | +21% |
Tim Kelly | Geelong | Midfield | 5 | 8.6 | 10.6 | +11% |
Scott Pendlebury | Collingwood | Midfield | 7 | 12.4 | 13.6 | +7% |
Xavier Duursma | Port Adelaide | Wing | 7 | 9.1 | 9.5 | +1% |
The renewed focus on tagging goes beyond de Boer.
Emerging Bomber Dylan Clarke, the round 13 NAB AFL Rising Star nominee, quelled Patrick Cripps and Jaeger O’Meara in his past two games.
The 'other' Curnow - Ed - has also been swung, perhaps belatedly, onto gun Lion Lachie Neale and Dogs superstar Marcus Bontempelli with great effect the past fortnight.
Coaches regularly offer reasons why they don't tag, but you can't argue with the results when an effective one is carried out.
Walters in rare company … again
Docker Michael Walters continues to enjoy the 'purplest' of purple patches.
The 28-year-old became the first player a fortnight ago to kick match-winning scores in back-to-back matches since Champion Data began tracking that feat in 1999.
Backing those efforts up should be difficult, but Walters was up to the task – registering 25 disposals and six goals, including two key late ones to ensure another Fremantle victory.
It was the second time in his career he managed at least that combination, following his 32-touch, six-goal outing against St Kilda in round 15, 2017.
Walters is now one of only five players to achieve this in the past two decades, joining Steve Johnson (five), Lance Franklin (three) and Jeremy Cameron and Matthew Lloyd (twice each).
Johnson incredibly did so three times in the 2011 season alone.
Find Trends on Apple Podcasts, Google Podcasts and Spotify
Slam Dunk for star Dog
Another Stats Files favourite, Western Bulldog Josh Dunkley, produced an extremely rare combination of numbers in a best-on-ground display on Saturday night.
Dunkley amassed a career-high 41 disposals, 17 contested possessions, seven clearances, 10 tackles and five inside 50s, as well as kicking a goal.
Juggling Josh kicks a ripper!#AFLBluesDogs pic.twitter.com/nLhjmLlYc3
— AFL (@AFL) June 15, 2019
Geelong's Joel Selwood (round 19, 2011) and Saint Jack Steven (round 16, 2016) are the only other footballers since 1999 to have at least 40 disposals, 15 contested possessions, five clearances, 10 tackles, five inside 50s and a goal in one game.
Brother, oh brother
Adelaide's Crouch brothers, Brad and Matt, are on track to break their own sibling record for the highest combined average disposals in a single season.
They racked up a whopping 78 possessions between them in the Crows' 33-point win over Richmond at Adelaide Oval on Thursday night.
BROTHERS | SEASON | COMBINED MATCHES | COMBINED DISPOSALS | AVERAGE DISPOSALS |
Brad Crouch/Matt Crouch | 2019 | 23 | 732 | 31.8 |
Brad Crouch/Matt Crouch | 2017 | 45 | 1386 | 30.8 |
Joel Selwood/Scott Selwood | 2016 | 29 | 780 | 26.9 |
Dayne Beams/Claye Beams | 2012 | 32 | 859 | 26.8 |
Chad Cornes/Kane Cornes | 2007 | 50 | 1339 | 26.8 |
Joel Selwood/Adam Selwood | 2010 | 40 | 1056 | 26.4 |
Zach Merrett/Jackson Merrett | 2016 | 33 | 859 | 26 |
Brad Crouch/Matt Crouch | 2016 | 38 | 977 | 25.7 |
Chad Cornes/Kane Cornes | 2008 | 35 | 891 | 25.5 |
Joel Selwood/Troy Selwood | 2010 | 29 | 736 | 25.4 |
Find In the Game on Apple Podcasts, Google Podcasts or Spotify
