

THESE are the numbers that highlight Melbourne's struggle to convert its well-worn football identity into victories.
The Demons last year produced the second-best contested possession differential ever recorded (+16.4) and remain in the top five in the competition this season (+5.2).
They also rank in the top five in both years for clearances, which should be a combination for great success.
Clayton Oliver is a clearance machine, but does he use the ball well once he's got it? Picture: AFL Photos 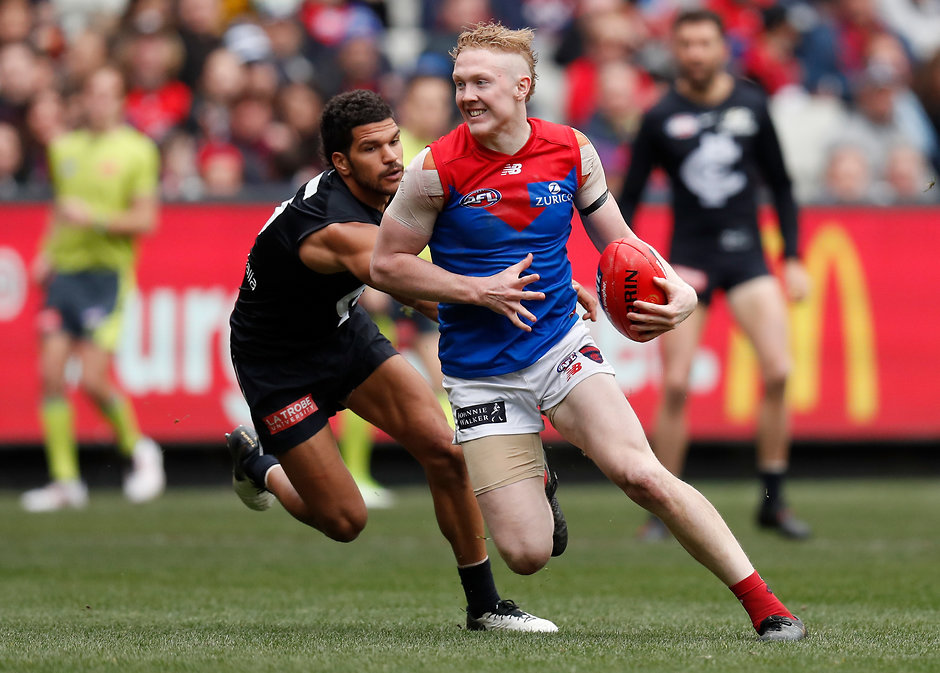
Champion Data statistics reveal that teams win more than three-quarters of their matches when they win both categories in 2019.
THE RUN HOME Where will your club finish?
However, Melbourne's drought-breaking rampage into a preliminary final last year has so far been followed by an injury-marred five-win campaign through 17 rounds.
CLUB | WON CONTESTED POSSESSION/WON GAME | WON CLEARANCES/WON GAME | WON BOTH STATS/WON GAME |
Geelong | 13/13 (100%) | 4/4 (100%) | 4/4 (100%) |
Brisbane | 6/6 (100%) | 8/8 (100%) | 5/5 (100%) |
West Coast | 5/5 (100%) | 10/8 (80%) | 3/3 (100%) |
Richmond | 4/4 (100%) | 2/2 (100%) | 2/2 (100%) |
St Kilda | 3/3 (100%) | 6/3 (50%) | 2/2 (100%) |
Sydney | 6/5 (83%) | 6/3 (50%) | 3/2 (67%) |
Collingwood | 11/9 (82%) | 7/6 (86%) | 6/5 (83%) |
Adelaide | 9/7 (78%) | 10/7 (70%) | 6/5 (83%) |
Essendon | 10/7 (70%) | 11/5 (46%) | 7/5 (71%) |
Fremantle | 10/7 (70%) | 10/6 (60%) | 8/6 (75%) |
GWS Giants | 13/9 (69%) | 12/7 (58%) | 11/7 (64%) |
North Melbourne | 9/6 (67%) | 5/5 (100%) | 5/5 (100%) |
Port Adelaide | 13/8 (62%) | 10/5 (50%) | 8/5 (63%) |
Western Bulldogs | 10/6 (60%) | 11/7 (64%) | 8/6(75%) |
Carlton | 5/3 (60%) | 10/4 (40%) | 4/3 (75%) |
Melbourne | 10/5 (50%) | 9/3 (33%) | 7/3 (43%) |
Gold Coast | 2/1 (50%) | 6/1 (17%) | 1/0 (0%) |
Hawthorn | 2/0 (0%) | 3/0 (0%) | 0/0 (0%) |
AFL AVERAGE | 141/104 (74%) | 140/84 (60%) | 90/68 (76%) |
Coach Simon Goodwin stated many times in the past 18 months how the Dees were "built" around contested ball and how that approach was "ingrained" in his players.
The problem this year is it's simply not working, even with the game's most dominant ruckman, dual All Australian Max Gawn, at their disposal.
Melbourne has also plummeted from the highest-scoring team out of stoppages and centre bounces in 2018 to ranking 17th and 18th in those respective categories in 2019.
Find Trends on Apple Podcasts, Google Podcasts and Spotify
A significant part of the Demons' issue is their League-worst kick ratings going inside 50 (-2.6%) and for shots at goal (-5.7%), while they are 11th in the competition for all kicks (-0.7%).
Kick rating takes into account the difficulty of a player's kick and attributes an expected percentage for any player to successfully hit a target in various scenarios.
A zero per cent rating means the footballer is performing as expected.
PLAYER | AVE CONTESTED POSSESSIONS | AVERAGE KICKS | KICK RATING* |
Clayton Oliver | 16.2 | 11.3 | -3.4% (ranked 370th) |
James Harmes | 11 | 12.5 | +1.3% (177th) |
Angus Brayshaw | 10 | 13.3 | +0.7% (208th) |
Jack Viney | 9.7 | 10.1 | -11.4% (508th) |
Christian Petracca | 9.6 | 10.1 | 0.0% (234th) |
* Based on the 526 players with at least 20 kicks
The Demons' best performers on this system with a minimum of 100 kicks this year are Nathan Jones (+5.1%), Christian Salem (+3.2%), Bayley Fritsch (+2.6%) and Harmes (+1.3%).
Salem spent a brief period at the start of last year as an inside midfielder before returning to his quarterback role at half-back.
As an interesting aside, Melbourne's expected hit rate with its field kicks (excluding kick-ins and shots at goal) of 51.5 per cent is the fourth-hardest in the AFL, so it's attempting to play a bold style.
FANTASY FORM WATCH Pig, Piglet, rage trades and your questions
Goodwin bemoaned his side's inefficiency with the ball in the weekend defeat to the Western Bulldogs.
"We're clearly a pretty good contested team but getting the ball to the outside and being effective with it and using it in the right way (is the challenge)," he said on Sunday.
The Dees' numbers suggest there was a mid-season tweak to their contested possession obsession, although they reverted back to their old ways against the Western Bulldogs on Sunday.
STATISTIC | ROUNDS 1-10 | ROUNDS 11-16 | ROUND 17 |
Contested possession rate | 43.6% | 38.4% | 49.8% |
Disposals differential | -26 | +26 | -63 |
Disposals | 355 | 395 | 314 |
Marks | 81 | 101 | 73 |
Prominent Dockers Ed Langdon and Bradley Hill, who both specialise away from the contest, are both believed to be on Melbourne's radar.
Might the Demons also inquire about triple premiership-winning Hawks winger Isaac Smith's availability?
Having said that, none of this speed-blessed trio is a strong performer this year in the kick rating metric, so the solution might have to be found within.

The Teague effect
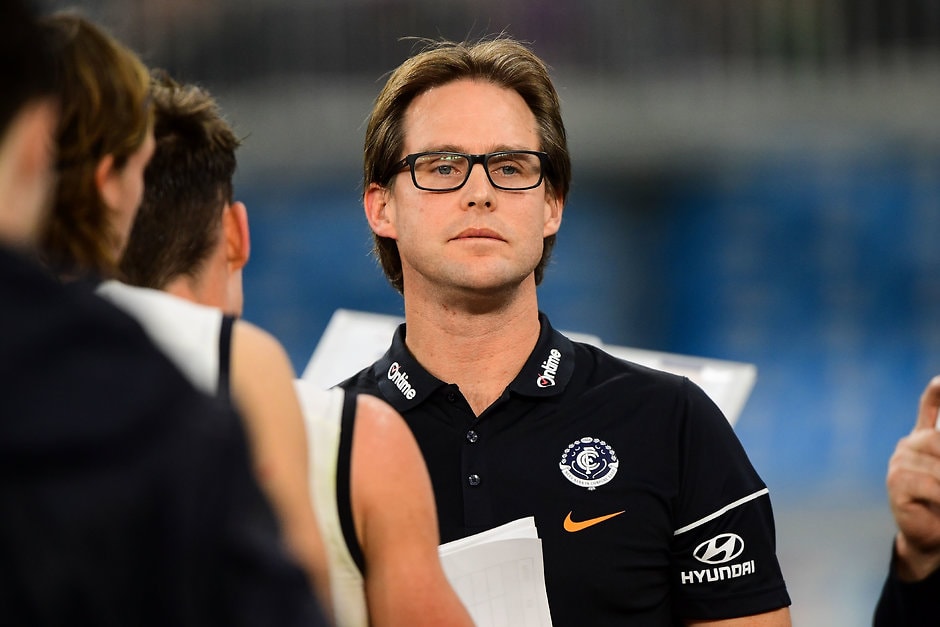
Any way you cut it, Carlton is a vastly superior team under caretaker coach David Teague than his predecessor Brendon Bolton.
The Blues boast a 3-2 record in Teague's five matches in charge – and the two losses were by a combined eight points.
So where's the improvement come from?
STATISTIC | ROUNDS 1-11 (BOLTON) | ROUNDS 12-17 (TEAGUE) |
Points for | 67.1 (ranked 17th) | 85.2 (ranked sixth) |
Points against | 90.3 (15th) | 81.6 (13th) |
Disposal differential | -51.6 (18th) | -6.6 (ninth) |
Contested possession differential | -10.5 (16th) | +7.6 (fourth) |
Time in forward half differential | -9:14 (17th) | +0:51 (seventh) |
Points from forward-half possession gains | 21.2 (16th) | 39.6 (first) |
Score per inside 50% | 41.3% (13th) | 46.9% (second) |
Clearances differential | -0.5 (11th) | +5.6 (third) |
Eagles' aerial streak over
Reigning premier West Coast's dramatic one-point defeat to Collingwood at Optus Stadium on Friday night marked the end of a quirky run.
The Eagles had won 24 straight matches when they took more than 90 marks, but their 97 grabs in round 17 didn't coincide with a 25th.
Victory in that match would have equaled the club record for the same statistic, which ended in 2017.
The AFL's Jekyll and Hyde
Port Adelaide continues to predictably be unpredictable and will enter round 18 with an 8-8 win-loss record.
On closer inspection, Ken Hinkley's men score 22 more points from intercepts in wins compared to losses, while they concede 14 extra points from that source in defeat.
That amounts to a costly six-goal turnaround.
STATISTIC | WINS | LOSSES |
Points for from Intercepts | 56.3 | 34.0 |
Intercept to score percentage (for) | 19.9% | 12.8% |
Points against from turnovers | 38.4 | 52.5 |
Intercept to score percentage (against) | 13.6% | 15.3% |
